A machine-learning model does not become production-ready simply because it performs well on a test set. Once deployed, it begins operating against data, users, infrastructure, and business conditions that continue to change even when the model code stays exactly the same.
That gap between model performance at deployment and model performance over time is where AI MLOps and Monitoring becomes critical.
In 2026, the problem is becoming harder as enterprises move beyond predictive models into generative AI and autonomous agents. Gartner predicts that 40% of organizations deploying AI will use AI observability to monitor model performance by 2028, arguing that the lack of standardized model telemetry makes AI incidents substantially harder to trace and resolve.
The risk is not theoretical. The Stanford AI Index 2026 reports 362 documented AI incidents in 2025, up from 233 in 2024, while responsible-AI measurement continues to lag behind rapidly expanding deployment.

Our position is straightforward: a model without monitoring is still an experiment, even if it is serving production traffic.
AI MLOps and Monitoring should create a continuous operating loop around the model: version what was deployed, observe how it behaves, identify degradation, diagnose why it happened, and make an explicit decision to maintain, roll back, retrain, or replace the system.
Let’s dive deeper into how AI MLOps and Monitoring works, which production signals actually matter, and how enterprises can build an operating model that keeps AI reliable after launch.
What AI MLOps and Monitoring Actually Means in 2026

MLOps applies software-engineering and operational disciplines to the machine-learning lifecycle. It connects experimentation, data, training, evaluation, deployment, model versioning, monitoring, and continuous improvement so AI systems can be operated repeatedly rather than managed as one-off data-science projects.
Google Cloud describes MLOps as a set of practices for improving the stability and reliability of ML systems after deployment, supported by workflow orchestration, experiment tracking, metadata management, model registries, feature management, model monitoring, and scalable training infrastructure. Google Cloud's current MLOps architecture makes an important point: production models need to keep up with changing environmental data to remain relevant.
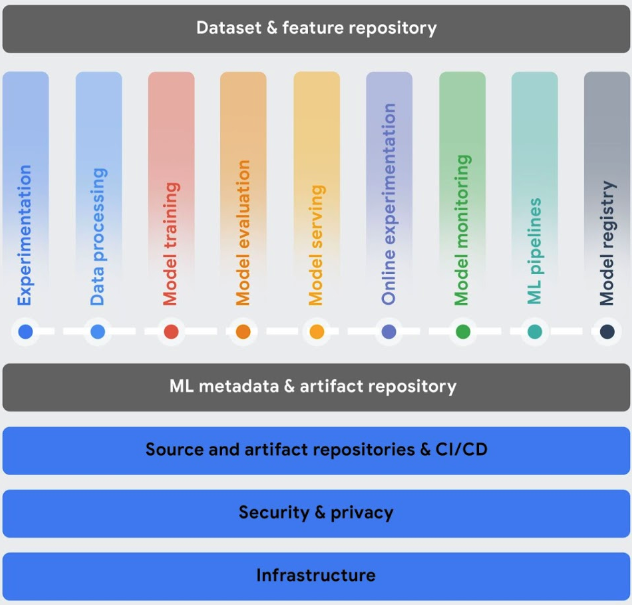
Google Cloud's current MLOps architecture (Source: Google Cloud)
MLOps and Model Monitoring Are Related, but They Are Not the Same Thing
Model monitoring is one capability inside a larger MLOps system.
| Capability | Primary purpose |
| Experiment tracking | Record models, parameters, datasets, and results |
| Model registry | Manage approved model versions |
| CI/CD | Test and deploy code and model changes consistently |
| Continuous training | Rebuild models when retraining is justified |
| Feature/data pipelines | Keep training and inference data reliable |
| Evaluation | Determine whether a candidate model meets release criteria |
| Monitoring | Detect degradation or abnormal production behavior |
| Observability | Diagnose why that behavior occurred |
| Rollback / incident response | Restore safe operation when production fails |
A monitoring dashboard can tell you that accuracy dropped. An operational MLOps system should also tell you which model version was running, which data distribution changed, which feature caused the alert, which deployment introduced the issue, and what recovery action is available.
This distinction becomes even more important with generative AI. A traditional model may primarily change when data distributions move. An LLM application can change because of the model provider, system prompt, RAG pipeline, tool definition, knowledge source, agent permission, or application code.
The unit being operated is no longer only the model. It is the AI system.
From MLOps to LLMOps and Agent Operations
For generative AI, the operational surface expands to include:
- Model and provider versions
- Prompts and system instructions
- Context-window composition
- RAG retrieval and reranking
- Guardrails
- Tool definitions
- Agent trajectories
- Token consumption
- Output quality
- Human escalation
- Safety and policy violations
This is why modern AI MLOps and Monitoring increasingly overlaps with LLMOps, AI observability, and governance.
A 2026 Grafana observability survey found that among organizations building or piloting LLM applications, 63% monitor output quality or accuracy, 53% trace LLM calls for latency and token usage, 44% monitor cost attribution, but only 39% track prompt versioning. The tooling itself also remains fragmented: 45% reported assembling observability from open-source components and 30% building it in-house. Grafana's 2026 State of Observability report illustrates how adoption is moving faster than operational standardization.

Read more: AI Readiness: How Ready Is Your Business for AI?
The MLOps Lifecycle: From Experiment to Continuous Production

A strong MLOps architecture should make the path from experiment to production reproducible.
A data scientist should not train a model locally, send a file to engineering, and hope someone remembers which dataset and parameters produced it. The code, model, configuration, environment, metrics, and lineage need to travel through a controlled lifecycle.
Conceptually:
Experiment
│
▼
Code + Data + Parameters
│
▼
Automated Training Pipeline
│
├── Data Validation
├── Training
└── Evaluation
│
▼
Model Registry
│
▼
Release Gate
│
▼
Staging
│
├── Integration Tests
├── Performance Tests
└── Acceptance Tests
│
▼
Production
│
▼
Telemetry + Monitoring
│
▼
Alert / Evaluation
│
┌──┴───────────────┐
▼ ▼
Rollback Retrain / Improve
Read more: AI Strategy: Building a Practical Roadmap for Enterprise AI
Version Everything That Can Change Production Behavior
Versioning should extend beyond the .pkl, .pt, or model checkpoint.
| For conventional ML, track: | For generative AI, also track: |
| Dataset versionFeature definitionsModel artifactHyperparametersRuntime environmentEvaluation reportDeployment configuration | Foundation-model versionSystem promptFew-shot examplesRetrieval configurationEmbedding modelRerankerGuardrailsTool schemasAgent workflows |
The reason is operational rather than bureaucratic. If output quality drops after deployment, teams need to identify what actually changed. A production release could therefore be described as:
release: support-agent-2.4.1
model:
provider: approved-provider
version: model-2026-09
prompt:
version: support-system-v18
retrieval:
embedding: embedding-v4
reranker: reranker-v2
top_k: 8
evaluation:
groundedness: 0.976
task_success: 0.943
critical_failures: 0
deployment:
previous_version: support-agent-2.4.0
rollback_enabled: true
Illustrative configuration.
This is what makes regression analysis possible. Without lineage, incidents become guesswork.
Use CI/CD — and Continuous Training Carefully
MLOps borrows CI/CD principles from software engineering, but machine learning introduces a third concept: CT, or continuous training.
CI validates changes. CD moves approved artifacts toward production. CT can retrain models when data or performance conditions indicate that the existing model is no longer appropriate. However, automatic retraining should not be the default response to every monitoring alert. A drift alert is evidence that something changed. It is not proof that retraining will fix the problem.
The cause could be a broken upstream pipeline, seasonal behavior, a new product mix, a schema change, fraud, sensor malfunction, a legitimate business shift, or a model that now needs a fundamentally different feature set.
A better loop is:
Drift detected
│
▼
Validate data quality
│
▼
Measure actual model impact
│
▼
Root-cause analysis
│
├── Data error ─────► Fix pipeline
├── Temporary shift ► Continue monitoring
├── Model decay ────► Retrain
└── Structural shift ► Redesign model
That is an important difference between automation and operational discipline.
Read more: AI Workflow Integration: Connecting AI With Enterprise Systems
What Should AI MLOps and Monitoring Track in Production?

Monitoring should answer more than “Is the endpoint up?”
Traditional infrastructure monitoring focuses on CPU, GPU, memory, network, requests, and errors. AI MLOps and Monitoring adds another set of questions: Is the data still valid? Is the model still accurate? Is it still making decisions for the same reasons? Are users getting the expected business outcome?
A useful monitoring framework has six layers.
| Layer | What to monitor |
| Infrastructure | Availability, CPU/GPU, memory, throughput, errors |
| Data | Missing values, schema, distribution, drift |
| Model | Accuracy, precision, recall, errors, prediction drift |
| Explainability | Feature attribution and behavior changes |
| GenAI / Agent | Groundedness, hallucination, tool use, traces, tokens |
| Business | Conversion, cycle time, automation rate, ROI |
Read more: AI Automation vs RPA: Key Differences, Use Cases, and How to Choose
Data Quality, Data Drift, and Training-Serving Skew
Production data can stop resembling the data used during model development.
Three concepts should be separated:
- Data quality describes whether inputs remain technically valid. Null rates, schema errors, invalid categories, out-of-range values, broken timestamps, or sensor errors can damage predictions even when the underlying business distribution has not changed.
- Training-serving skew occurs when training and inference pipelines produce systematically different data.
- Data drift occurs when the statistical distribution of production input features changes from the chosen baseline.
For example, a credit model trained primarily on salaried employees could begin receiving a much larger proportion of self-employed applicants. The model artifact did not change, but its operating environment did.
Google Cloud's current Model Monitoring supports monitoring of input-feature drift, output-inference drift, and feature-attribution changes against configurable baselines. Its current implementation can use statistical measures such as Jensen-Shannon Divergence and SHAP-based feature attribution.
Prediction Drift and Model Performance
Prediction drift means the distribution of model outputs has changed. That is an important signal, but it does not necessarily mean quality has degraded. A fraud model may suddenly classify more transactions as suspicious because fraud really increased.
That is why ground truth matters. When eventual labels become available, production predictions should be compared with real outcomes using the metrics appropriate to the task:
- Accuracy
- Precision
- Recall
- F1
- MAE / RMSE
- Business-specific error rates
Microsoft's current Azure Machine Learning model-monitoring guidance supports signals spanning data drift, prediction drift, data quality, feature-attribution drift, and model performance. Microsoft also recommends beginning monitoring immediately after deployment, selecting baselines appropriate to each signal, and adjusting monitoring frequency according to the rate at which production data accumulates.
Concept Drift Is More Dangerous Than It Looks
Data drift asks whether the input distribution changed.
Concept drift asks whether the relationship between inputs and outcomes changed.
For example, consumer purchasing patterns that once predicted churn may stop working after a competitor changes pricing. The same customer characteristics now produce different outcomes.
This is more difficult to detect because feature distributions can appear stable while model accuracy deteriorates.
Ground-truth monitoring remains the strongest signal when labels are available.
Feature Attribution and Bias Drift
Even if headline accuracy remains acceptable, the model may begin relying on different variables.
For regulated or high-risk use cases, this matters.
AWS's Machine Learning Lens recommends monitoring data quality, model quality, bias drift, and feature-attribution drift, alongside explainability and retraining pipelines. Its guidance treats drift detection as the beginning of a response workflow rather than an isolated dashboard metric.
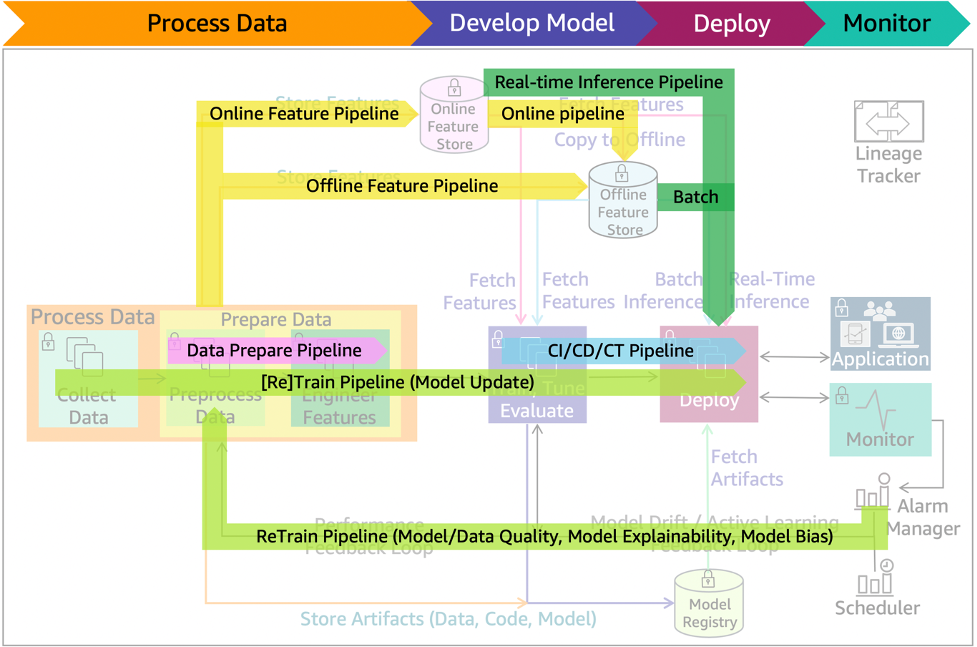
ML lifecycle with model update, retrain, and batch or real-time inference pipelines (Source: AWS)
Generative AI Needs Different Telemetry
LLM applications introduce metrics that conventional ML monitoring does not capture well. Depending on the use case, monitor:
- Answer correctness
- Groundedness
- Hallucination rate
- Citation accuracy
- Retrieval Recall@K
- Prompt version
- Input/output token volume
- Cost per request
- Time to first token
- End-to-end latency
- Guardrail violations
- Refusal rate
- Human escalation
- User feedback
For RAG, separate retrieval quality from generation quality. If groundedness falls, determine whether the LLM ignored correct evidence or whether the correct evidence was never retrieved.
Read more: Enterprise AI Chatbots: Building AI Assistants for Real Business Workflows
AI Agents Need Trajectory Monitoring
Agents add another layer because they can act across multiple steps.
Monitor the trajectory:
User Request
│
▼
Agent
│
├── Retrieval
├── Tool A
├── Tool B
├── Reason / Decide
└── Business Action
Important signals include:
- Task-success rate
- Tool-selection accuracy
- Invalid tool arguments
- Number of tool calls
- Permission violations
- Looping behavior
- Human-approval rate
- Recovery after tool failure
- Total latency
- Cost per completed task
Do not optimize only for final-answer quality. An agent that eventually reaches the correct result after 25 unnecessary tool calls is technically successful and operationally poor. The best business metric is often cost per successful task, not cost per token.
How to Build an Enterprise Monitoring and Response Loop

The strongest monitoring systems do not stop at alert generation. They connect signals to an operational response.
A practical architecture looks like this:
Production AI
│
├── Inputs
├── Outputs
├── Model metrics
├── Infrastructure metrics
├── Traces
└── Business outcomes
│
▼
Telemetry Layer
│
▼
Monitoring / Evaluation
│
Threshold / Anomaly
│
▼
Alerting
│
▼
Incident Triage
│
┌────────────┼───────────────┐
▼ ▼ ▼
Observe Rollback Retrain
│ │
└──────────────┬─────────────┘
▼
Re-evaluation
│
▼
Release
Define Baselines Before Defining Alerts
A threshold has little meaning without a useful baseline. Depending on the metric, compare production behavior with:
- Training data
- Validation data
- Previous production window
- Previous model version
- Control cohort
- Historical seasonal period
A retailer comparing December traffic with October may trigger large drift alerts that are simply seasonal behavior. Monitoring design needs domain knowledge.
Avoid Alert Fatigue
“Monitor everything” is usually bad advice. A platform generating thousands of low-value alerts trains engineers to ignore the dashboard. Monitor the signals that map to meaningful failure and apply different severity levels. For example:
| Alert | Severity | Response |
| GPU utilization >80% | Low | Capacity review |
| Data drift above threshold | Medium | Investigate |
| Model accuracy below SLA | High | Block next rollout |
| Sensitive-data exposure | Critical | Disable workflow |
| Agent executes unauthorized action | Critical | Stop agent + incident response |
This is where AI observability extends beyond monitoring. Monitoring says something is wrong. Observability helps answer why.
Build Rollback Before You Need It
Model deployment needs a rollback strategy just like software deployment. Common approaches include:
- Blue/green deployment
- Canary release
- Shadow deployment
- Champion/challenger models
- Feature flags
- Previous-version rollback
A new model should rarely receive 100% of traffic immediately when failures can materially affect customers or operations.
Canary deployment can expose a small percentage of production traffic to a candidate model while comparing quality, latency, errors, and business metrics against the incumbent.
Close the Loop With Evaluation
A production incident should improve the test suite.
The pattern should be:
Production failure
↓
Root cause
↓
New evaluation case
↓
Fix
↓
Regression test
↓
Release
Over time, the organization's evaluation dataset becomes a record of what production has taught the system. This is one reason AI MLOps and Monitoring and AI Model Evaluation should be designed together rather than operated by disconnected teams.
Read more: Predictive Automation Systems: How AI Moves Operations From Reactive to Proactive
Monitor Business Value, Not Only Technical Health
An AI system can be technically healthy while failing commercially. Suppose a customer-support assistant maintains 97% groundedness and 99.9% uptime, but employees ignore it because it adds two minutes to every workflow.
From an infrastructure perspective, the system is healthy. From a business perspective, it is failing. Connect AI telemetry to metrics such as:
- Handling time
- Automation rate
- Defect reduction
- Conversion
- User adoption
- Human-review workload
- Cost per completed task
- Revenue or cost impact
This is where MLOps moves from model maintenance into AI operations.
Read more: AI ROI Strategy: How to Measure Business Value From Enterprise AI
How SotaTek Implements AI MLOps and Monitoring

SotaTek approaches AI MLOps and Monitoring as part of the production architecture, rather than maintenance added after the model goes live.
Our current AI Development Services explicitly cover LLMOps & AI Operations, including model, prompt, and application versioning; performance, latency, and cost monitoring; drift and failure detection; and continuous testing and optimization. The service also covers AI maintenance and MLOps, model evaluation, governance, logging, security controls, and enterprise integration.
A Practical Delivery Model
For a production AI system, the operating flow typically covers five connected areas.
1. Establish the baseline before deployment. Define the model version, dataset, evaluation results, accepted quality levels, infrastructure targets, latency budget, cost budget, and business KPIs. Without this baseline, production monitoring has nothing meaningful to compare against.
2. Instrument the complete execution path. Collect input, output, infrastructure, model, retrieval, cost, and workflow telemetry. For an agent, capture tool calls and approvals as well.
3. Define monitoring objectives and thresholds. Prioritize the signals that indicate business or safety risk instead of creating alerts for every measurable variable.
4. Connect alerts to operating actions. Document whether each condition should trigger investigation, traffic reduction, rollback, retraining, human escalation, or complete shutdown.
5. Feed production evidence back into engineering. Add real failures to evaluation suites, reassess model choices, update prompts or retrieval, and deploy improvements through controlled release pipelines.
The result is a closed loop:
Build
↓
Evaluate
↓
Deploy
↓
Monitor
↓
Diagnose
↓
Improve
↓
Re-evaluate
↓
Deploy Again
What Should an Enterprise MLOps Stack Contain?
The technology will vary by cloud and architecture, but the capabilities should be recognizable.
| Layer | Required capability |
| Source control | Code, prompt, configuration versioning |
| Data | Data validation and lineage |
| Experimentation | Runs, metrics, parameters |
| Registry | Approved model/artifact versions |
| Pipeline | Automated training and evaluation |
| Deployment | Dev/staging/production promotion |
| Serving | Reliable inference infrastructure |
| Telemetry | Logs, metrics, traces |
| Evaluation | Online/offline quality measurement |
| Monitoring | Drift, quality, safety, latency, cost |
| Governance | Access, approvals, auditability |
| Incident response | Alerts, rollback, escalation |
The important decision is not whether to buy the maximum number of MLOps tools. It is whether every production model has a reproducible lifecycle and an accountable response when monitoring shows that behavior changed.
Where to Start
Organizations do not need to build a full internal MLOps platform before their first AI use case. Start with the failure modes that matter.
For one predictive model, that may mean version control, a registry, drift monitoring, ground-truth performance tracking, and rollback. For an enterprise RAG system, retrieval evaluation, prompt/model versioning, groundedness, latency, and cost may deserve more attention. For AI agents, traces, permissions, tool failures, task success, and human escalation become essential. Architecture should follow risk.
Read more: AI Implementation Partner: What Enterprises Should Look for Before Scaling AI
AI MLOps and Monitoring Checklist
Before calling an AI system production-ready, confirm:
- Are models, prompts, data, and configurations versioned?
- Can every deployment be reproduced?
- Is there an approved model registry?
- Are release criteria automated where practical?
- Is production inference telemetry collected?
- Are data quality and drift monitored?
- Is actual model quality measured when ground truth arrives?
- Are latency, availability, and infrastructure monitored?
- Are cost and resource consumption visible?
- For RAG, are retrieval and generation monitored separately?
- For agents, are tools, trajectories, permissions, and approvals traced?
- Are alerts tied to defined response procedures?
- Can the team roll back quickly?
- Are production failures converted into regression tests?
- Is someone explicitly accountable for production AI performance?
If the answer to several of these questions is no, the organization may have deployed a model, but it does not yet have a mature MLOps capability.
Conclusion
AI MLOps and Monitoring is the operating layer that separates an AI demo from an AI system an enterprise can depend on. Deployment is only the beginning. Models encounter new data, user behavior changes, infrastructure fails, model providers update, prompts evolve, knowledge bases drift, and agents gain more authority.
The right response is a lifecycle in which every important artifact is versioned, every release is evaluated, production behavior is observable, meaningful degradation triggers a response, and every incident feeds back into the next version.
The best MLOps teams are therefore not the teams that retrain models most often. They are the teams that know when the model changed, why performance changed, whether the change matters, and what action should follow.
If your organization is moving AI from PoC into production or needs stronger monitoring around existing predictive models, LLM applications, RAG systems, or AI agents, contact SotaTek's AI team to design the MLOps architecture, monitoring framework, evaluation loop, and operational controls required for reliable enterprise AI.

 https://www.sotatek.com/
 (+84)2466585248